Insights on Repair Costs & Total Losses: 2019-2025 Data report
Auto Claims Assist | Data Insights Report
Dataset: 31,299 non-fault claims (01 Jan 2019 – 18 Jun 2025) combined with public data from UK industry and government bodies.
Key Data Insights at a Glance
| Metric | 2019 | 2025 YTD | % / pp Change |
|---|---|---|---|
| Average Repair Cost | £4,162 | £5,191 | ▲ 24.7 % |
| Proportion of Vehicles Written Off | 58 % | 66 % | ▲ 8 pp |

Executive Summary: An Industry in a Perfect Storm
The UK’s automotive insurance and repair sector is under significant and sustained pressure. A "perfect storm" of soaring operational costs, a critical shortage of skilled labour, and the increasing complexity of modern vehicles has led to record-breaking insurance payouts and an unprecedented number of vehicles being written off.
Data from the Association of British Insurers (ABI) reveals that motor insurers paid out a record £11.7 billion in claims during 2024, a 17% increase from the previous year. These costs reflect deeper market pressures that increasingly make it more economical for insurers to write a vehicle off than to repair it.
The consequences are now rippling out to every UK driver, manifesting as higher insurance premiums and growing disputes over vehicle valuations. This data-led report/article synthesises Auto Claims Assist's internal data with verified industry-wide statistics to analyse the forces driving this trend and what it means for UK drivers.
1. Auto Claims Assist Data: A Six-Year Overview
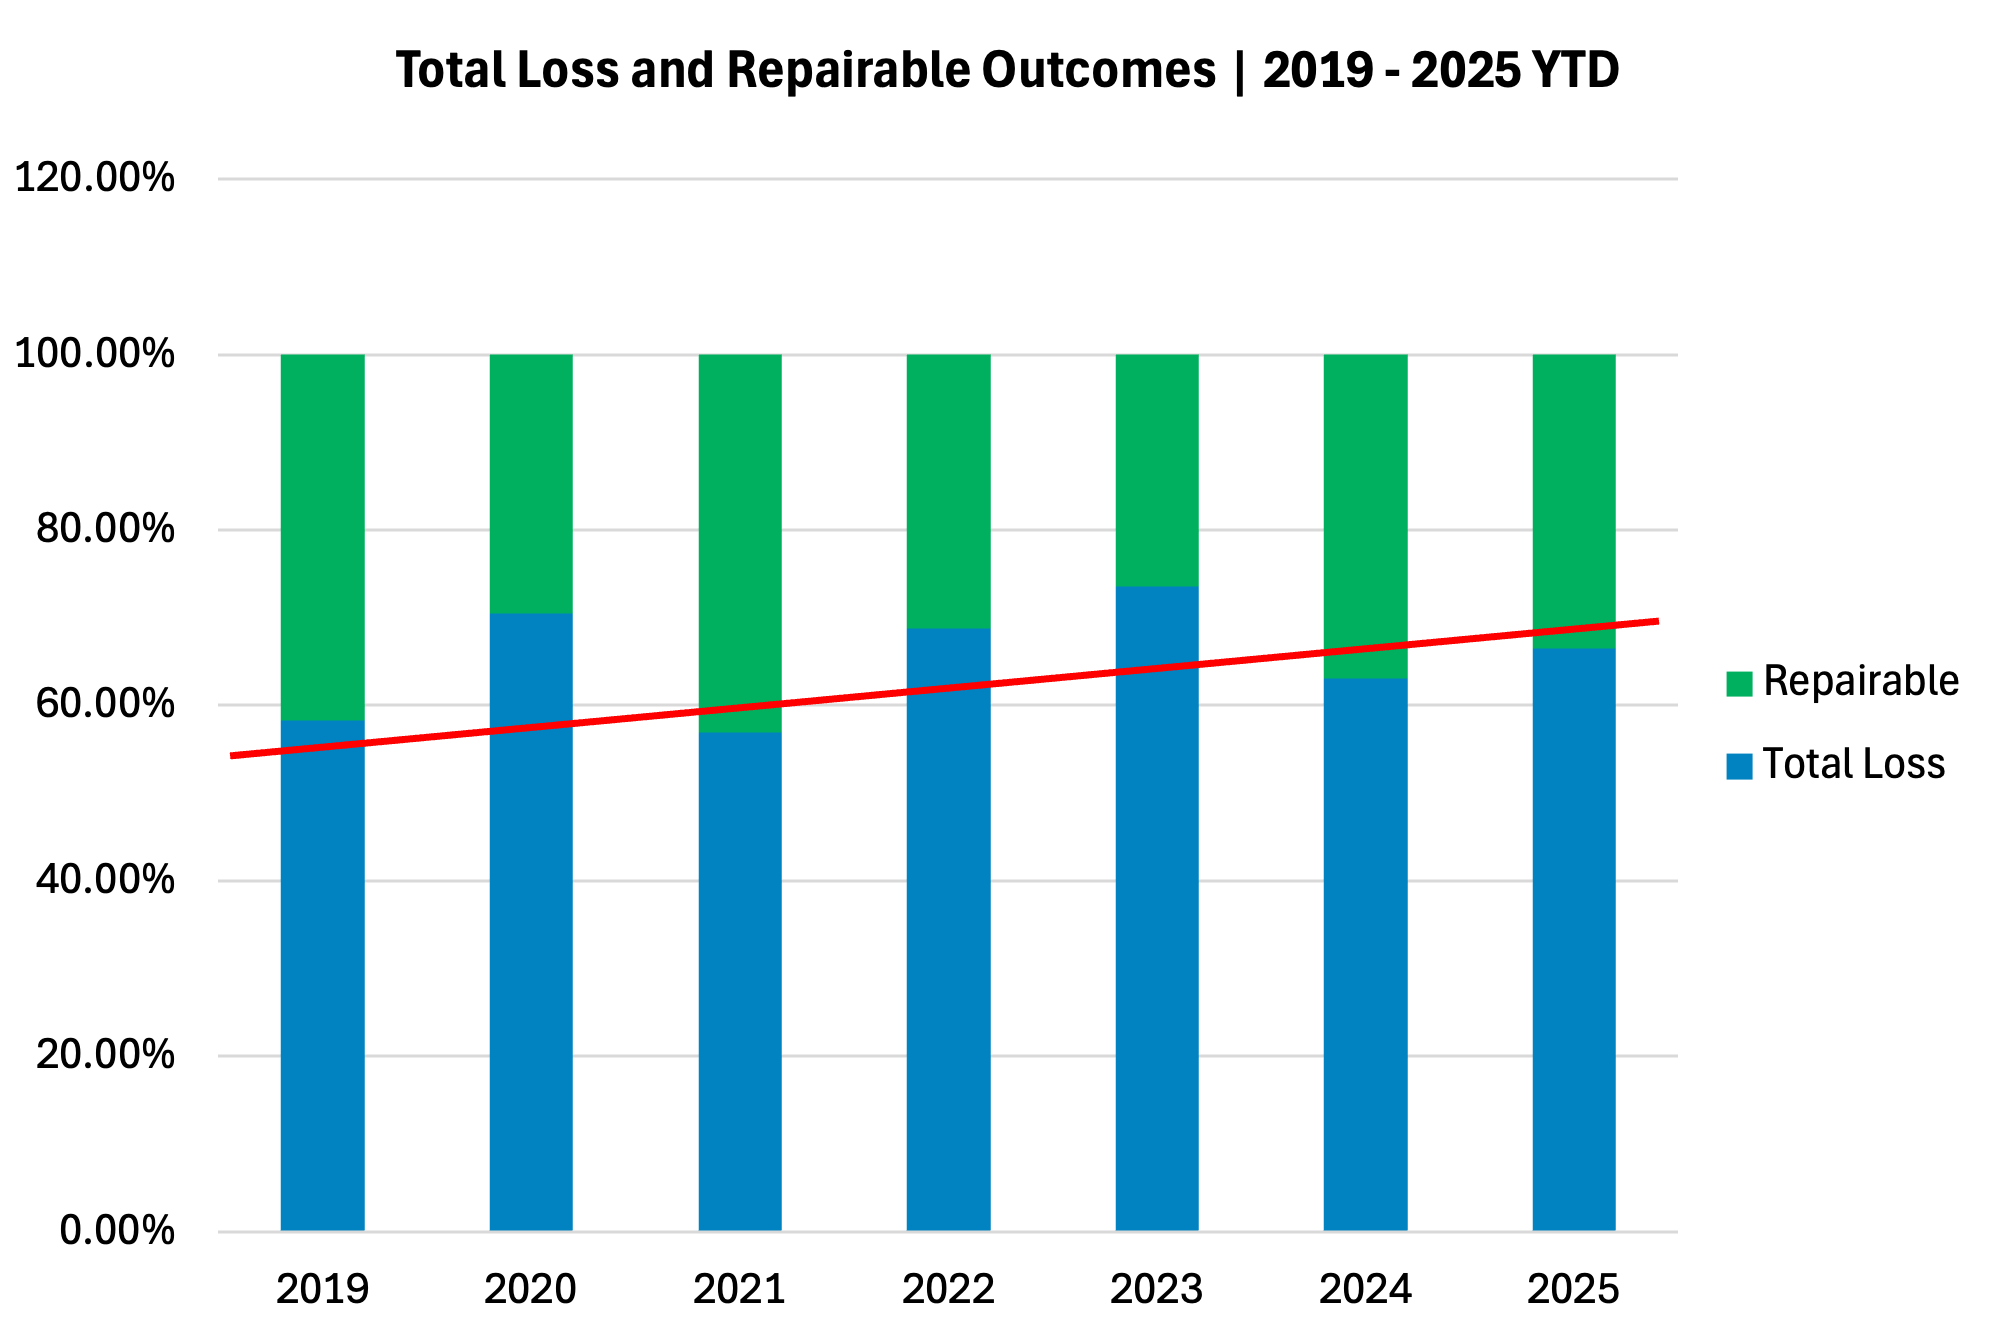
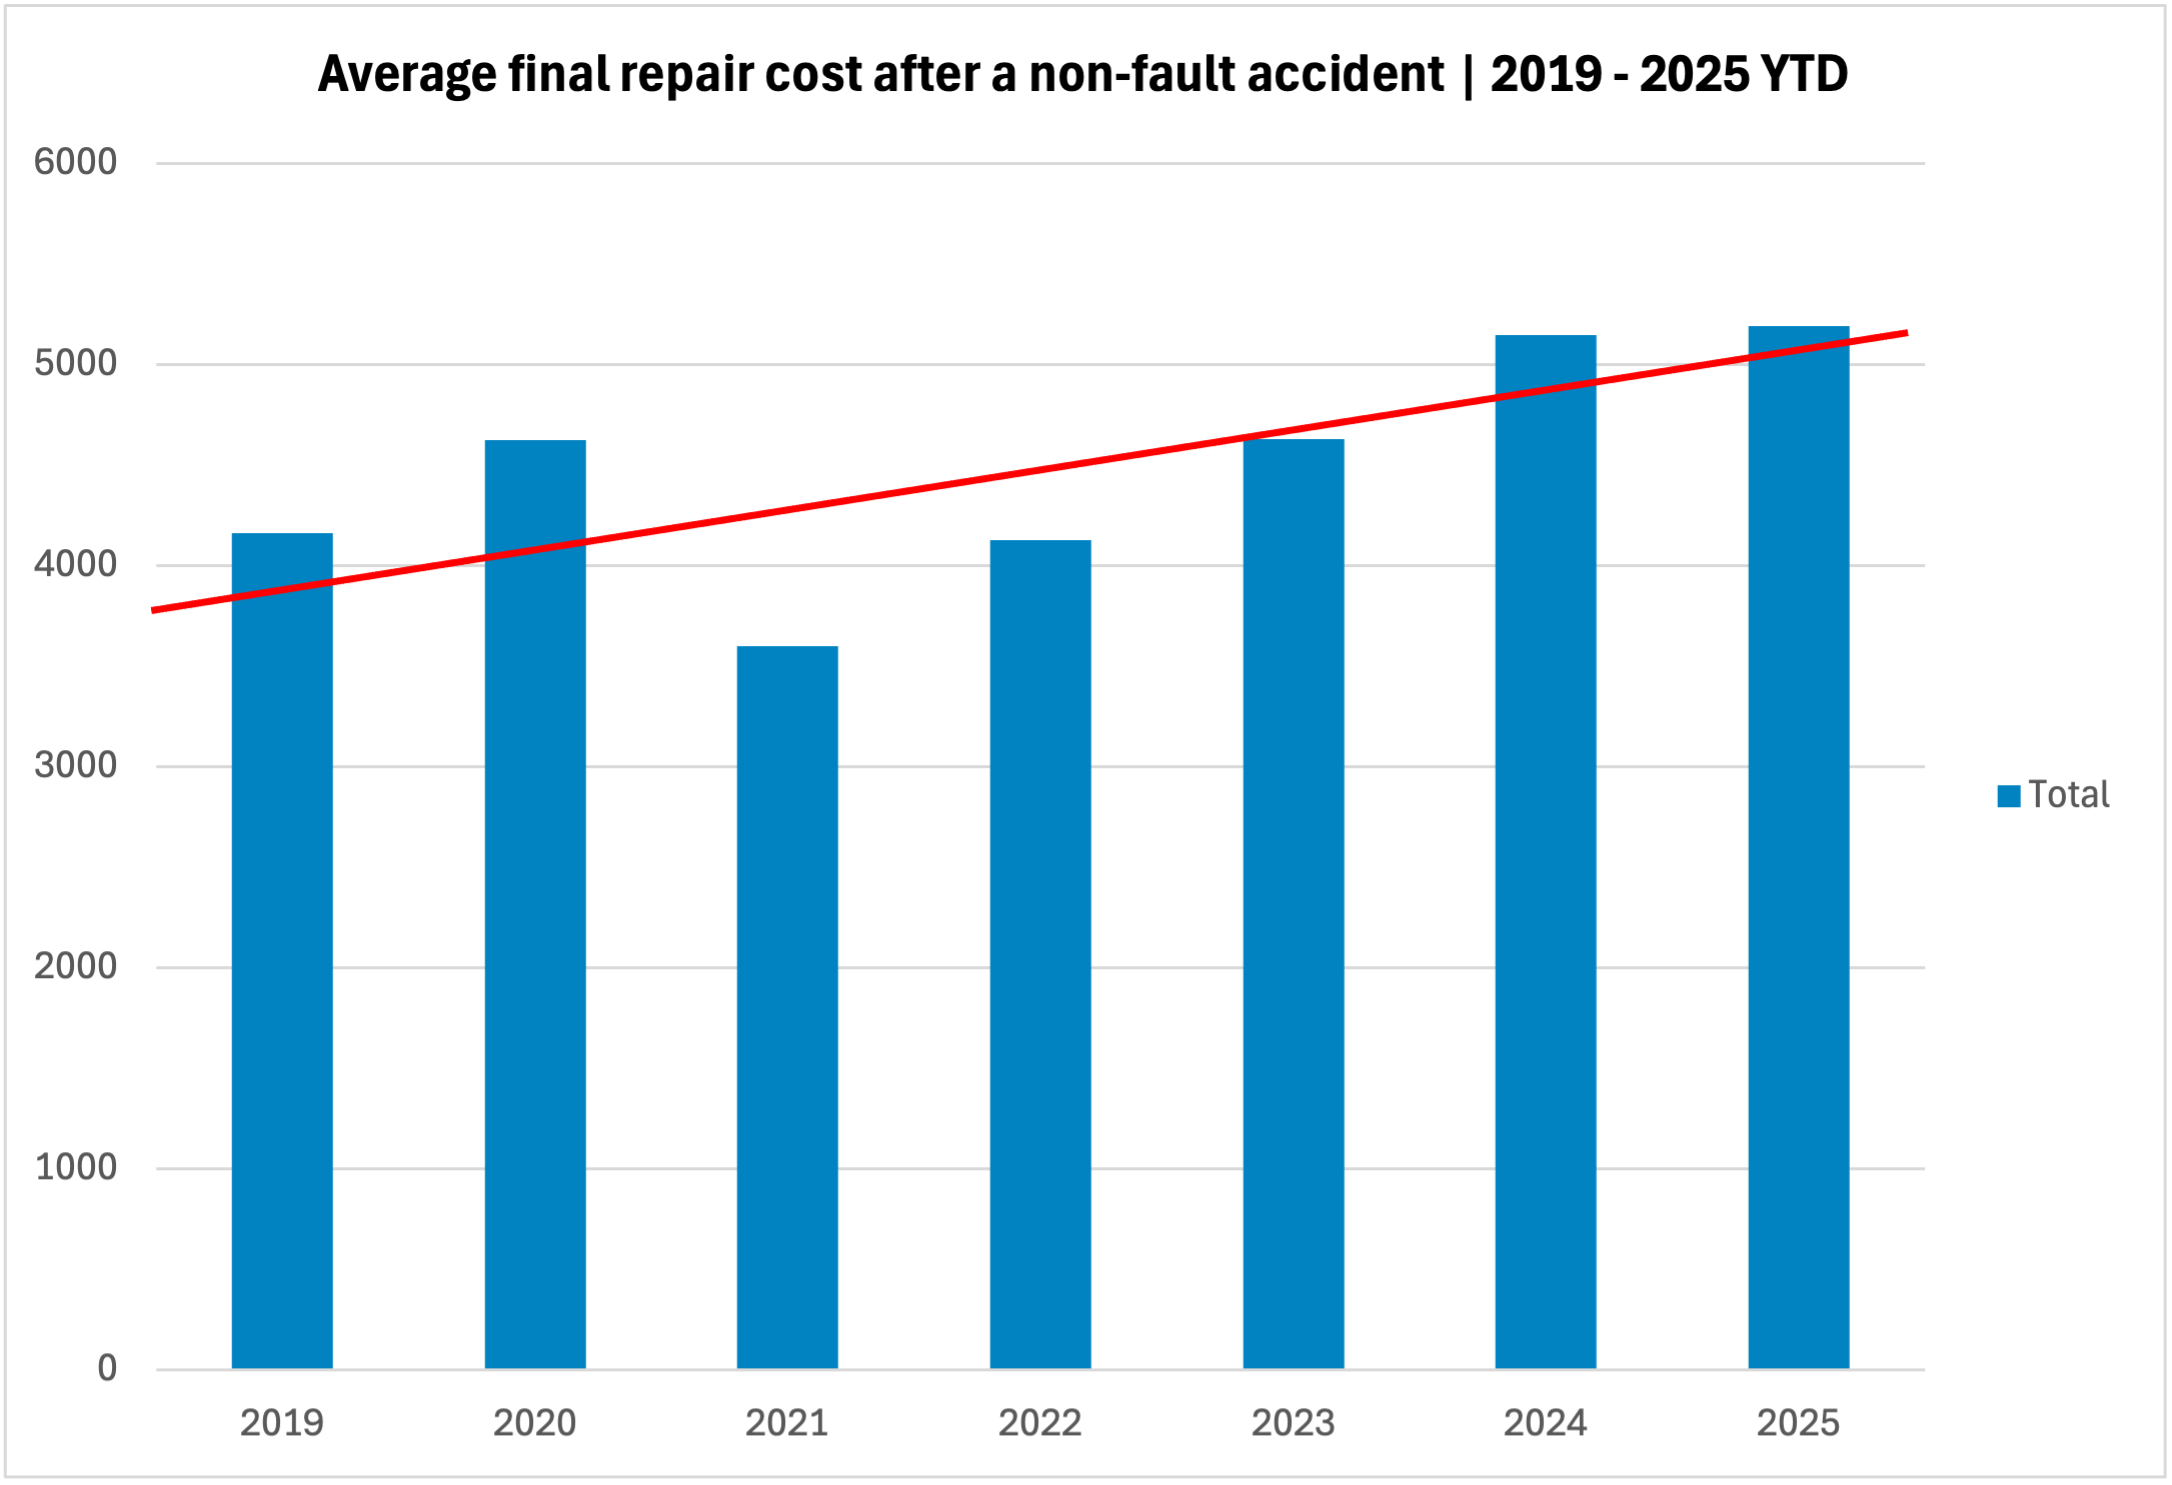
Our proprietary data, drawn from over 31,000 non‑fault claims, tracks the year‑on‑year trends behind today’s market pressures. Since 2019, the average cost to repair a vehicle has climbed significantly, while the proportion of vehicles being written off has remained at historically high levels, peaking at over 73% in 2023.
Auto Claims Assist Claims Data (2019 - 2025 YTD)
| Year | Average Repair Cost | Total Loss % | Repairable % |
|---|---|---|---|
| 2019 | £4,162 | 58.25% | 41.75% |
| 2020 | £4,625 | 70.47% | 29.53% |
| 2021 | £3,597 | 56.95% | 43.05% |
| 2022 | £4,128 | 68.82% | 31.18% |
| 2023 | £4,628 | 73.57% | 26.43% |
| 2024 | £5,147 | 63.11% | 36.89% |
| 2025 YTD | £5,191 | 66.50% | 33.50% |
Source: Auto Claims Assist proprietary claims data, 2019‑2025


Source: Auto Claims Assist proprietary claims data, 2019‑2025


Source: Auto Claims Assist proprietary claims data, 2019‑2025
2. The Core Symptom: The Write‑Off Trend
Our internal findings are mirrored in wider market statistics. Data obtained from the Driver and Vehicle Licensing Agency (DVLA) via a Freedom of Information request shows that 562,185 vehicles were recorded as written off in 2024.
The Escalating Trend of UK Vehicle Write-Offs (2019–2024)
| Year | Vehicles Written-Off |
|---|---|
| 2019 | 556,418 |
| 2020 | 414,593 |
| 2021 | 449,737 |
| 2022 | 524,321 |
| 2023 | 559,870 |
| 2024 | 562,185 |
Source: Allegiant
This surge is driven by simple economics. An insurer will declare a vehicle a total loss when the cost of repair approaches the vehicle's pre-accident value (PAV). As the forces detailed below drive repair costs higher, an increasing number of vehicles are breaching this economic threshold.
3. Analysis: Three Forces Behind the Trend
The write-off epidemic is not an isolated event but the result of multiple converging pressures on the UK's vehicle repair sector.
Force 1: The Squeezed Repair Sector – Soaring Parts and Energy Inflation
Garages and bodyshops are facing unprecedented operational cost inflation. This is not just a feeling; it is a measurable reality reflected in the data.
Breakdown of Key Cost Drivers
| Cost Driver | Data / Context |
|---|---|
| Parts Prices | Analysis of a common basket of vehicle parts shows a 35% price hike between 2020 and 2024, significantly outpacing general inflation. These increases are driven by global supply chain disruption and higher raw material costs. |
| Supply-Chain Delay | Post-Brexit customs checks and global disruption continue to extend lead times for many EU-sourced components, inflating courtesy-car/hire car bills. |
| Labour Rates | The Institute of the Motor Industry (IMI) reported 23,000 vacancies in the automotive aftermarket in early 2024, putting upward pressure on wages to attract and retain talent. |
| Energy & Overheads | According to the Office for National Statistics (ONS), the average price of electricity for UK business users in late 2024 was 75% higher than in the first quarter of 2021, before the energy crisis. |
| Repair complexity | Sensors, cameras and battery modules often require specialist recalibration or replacement. |
Sources: ONS, Fleet News
Force 2: The Skills Gap – A Critical Shortage of Qualified Technicians
The UK's automotive repair industry has a well‑documented labour shortage, which is driving up labour costs and lengthening repair times.
- The Institute of the Motor Industry (IMI) reported 23,000 vacancies in the automotive aftermarket in early 2024.
- A survey by The Motor Ombudsman found that 48% of garages cited recruitment as a significant operational hurdle.
This skills gap creates a bottleneck, meaning fewer technicians are available to handle an increasingly complex workload, leading to delays and higher costs that contribute to write-off decisions.
Force 3: The Technology Challenge – The Rising Cost of Repairing Modern Vehicles
The growing sophistication of modern cars, particularly Electric Vehicles (EVs) and those with Advanced Driver Assistance Systems (ADAS), adds further cost and complexity.
- According to the IMI, only 22% of UK technicians are qualified to work safely on EVs. The skills gap for ADAS is even more acute, with only 2% of technicians formally qualified.
- Research from Thatcham indicates that EVs can cost up to 25% more and take 14% longer to repair than their petrol or diesel counterparts.
Repairs to complex components like battery modules, sensors, and cameras require specialist training and equipment, adding cost and time to the claims process.
4. Brand-Level Insights: A Deeper Dive into the Data
Our internal data on non-fault claims from 2019–2025 reveals that the likelihood of a vehicle being written off varies significantly by manufacturer. This reflects a combination of a model's average age and market value, parts availability, and repair complexity.
Share of claims resulting in a total-loss decision, 2019–2025 (Top 20 Makes)
| Rank | Make | Total-loss % | Commentary |
|---|---|---|---|
| 1 | Renault | 80.18% | Spares delays extend hire-car duration, tipping borderline cases into total loss. |
| 2 | Citroën | 79.56% | Replacement parts are expensive relative to vehicle value, especially for older models. |
| 3 | Vauxhall | 79.30% | Large pool of ageing Corsa/Astra models depresses PAV, so even moderate damage often makes repair uneconomical. |
| 4 | Fiat | 78.95% | Smaller vehicle sizes and low PAVs make moderate damage uneconomical to repair. |
| 5 | Honda | 78.10% | Older Civics/Jazz cars dominate the claim mix; OEM parts can be costly and slow to source, pushing up repair bills. |
| 6 | Peugeot | 77.69% | Sensor-heavy bumper assemblies drive up repair costs, pushing borderline cases over the limit. |
| 7 | Ford | 71.88% | Large numbers of older Fiesta/Focus models lower typical PAVs, so even moderate front-end damage can exceed the write-off threshold. |
| 8 | Seat | 71.76% | Parts availability delays inflate hire duration; moderate frontal damage often triggers write-offs. |
| 9 | Nissan | 69.80% | Ageing Qashqai and Micra fleets contribute to above-average write-off rates. |
| 10 | Skoda | 66.13% | Skewed toward older Fabia/Octavia models with modest market values. |
| 11 | Toyota | 65.54% | Strong residuals on newer models help mitigate total losses, but older vehicles still vulnerable. |
| 12 | Volkswagen | 64.85% | Wide spectrum of model ages/values; repairability varies sharply by variant. |
| 13 | Hyundai | 64.29% | Lower‑than‑average parts pricing helps, but ageing i10/i20 fleets and supply delays still elevate write‑offs. |
| 14 | MINI | 63.16% | Compact body structure and tightly integrated electronics can drive up repair costs. |
| 15 | Jaguar | 62.65% | Repair costs high due to brand expectations and limited volume parts. |
| 16 | Volvo | 61.83% | Solid repairability, but high parts pricing and safety systems still trigger write-offs. |
| 17 | BMW | 56.51% | Higher PAV offers repair headroom, but complex systems and parts cost remain a challenge. |
| 18 | Audi | 55.41% | ADAS systems and labour-intensive repairs impact borderline damage cases. |
| 19 | Land Rover | 43.91% | High PAV and rugged construction reduce write-offs unless structural/frame damage occurs. |
| 20 | Mercedes-Benz | 39.49% | One of the lowest among major brands; strong resale value and repair viability unless battery/airbag hit. |
5. The Impact on Insurers: Record Claims Costs
Together, these forces have lifted insurer costs to record highs. The ABI's 2024 data provides a clear picture of the financial impact.
UK Motor Insurance Claims - Key Annual Statistics (2024)
| Metric | Value | Year-on-Year Change | Source |
|---|---|---|---|
| Total Claims Payout | £11.7 billion | +17% | ABI |
| Total Vehicle Repair Costs | £7.7 billion | +24% | ABI |
| Average Annual Claim Value | £4,900 | +13% | ABI |
| Average Q4 2024 Claim Value | £5,300 | All-time high | ABI |
| Average Annual Premium | £622 | +15% | ABI |
Source: ABI
The £7.7 billion spent on vehicle repairs alone underscores that the crisis is rooted in the escalating cost of fixing vehicles, which directly fuels the rise in total payouts.
6. What This Means for Drivers: Higher Premiums and More Valuation Disputes
The financial pressures on insurers are inevitably passed on to consumers, who face two primary consequences:
- Higher Insurance Premiums: The average motor insurance premium rose by 15% in 2024, a direct reflection of the record claims costs being incurred by the industry.
- Valuation Disputes: As more vehicles are written off, the accuracy of settlement offers is coming under increased scrutiny. The Financial Ombudsman Service (FOS) reported a 38% increase in car/motorcycle insurance complaints in 2023/24, with a key area of dispute being insurers undervaluing vehicles. The Financial Conduct Authority (FCA) has already reminded insurers of their duty to make fair settlement offers. For drivers with outstanding finance, a low valuation can be particularly damaging, as the payout may not be sufficient to clear the loan, leaving them in debt for a car they no longer own.
7. How Accident Management Support Helps
The data in this report paints a clear picture: with write-off rates peaking at over 73% and the average repair cost now exceeding £5,100, the non-fault driver is at a greater risk than ever of being left out of pocket.
In this environment, an independent advocate is more important than ever for non‑fault drivers.
Auto Claims Assist works exclusively on behalf of UK drivers to ensure they are treated fairly throughout the claims process.
David Reid, Claims Operations Manager of Auto Claims Assist, explains: "When you see in our data that the write-off rate has jumped from 58% to over 73% at its peak, it highlights a really important issue: the valuation process is more important than ever. Our role is to step in and champion the driver's case. We use live market data to ensure the settlement offer reflects the vehicle's true pre-accident value, not just what's convenient for an insurer. We exist to close that gap and ensure fairness for our clients."
How we help drivers after a non-fault accident:
- Securing Your Vehicle's True Market Value: An insurer's initial settlement offer is often based on standardised valuation guides that may not account for your vehicle's specific condition or the current market. We conduct our own independent, evidence-based valuations using live data from thousands of listings. This ensures your settlement reflects your vehicle's real-world worth, protecting you from unfairly low offers.
- Keeping You Mobile, Immediately: We provide a comparable replacement vehicle from day one of your claim. You will not have to wait for insurers to debate and agree on liability, a process that can take weeks. This removes the stress and major inconvenience of being without transport, allowing you to carry on with your daily life uninterrupted.
- Managing the Entire Process, So You Don't Have To: A non-fault accident is stressful enough without the added administrative burden. We handle every aspect of the claim on your behalf. This includes arranging vehicle recovery and secure storage, liaising with independent engineers, and managing all communications and negotiations with the at-fault party's insurer. We take the pressure off your shoulders.
Our objective is simple: to ensure that a non-fault accident disrupts your life as little as possible and that you receive the full and fair settlement you are entitled to.
8. Conclusion: An Industry at a Crossroads
The current write‑off bias is not a temporary blip but reflects deeper economic and structural pressures. With the skills shortage still acute and vehicles becoming ever more technologically advanced, these trends are likely to persist. Attracting and training the next generation of EV and ADAS-qualified technicians remains one of the most significant challenges for the entire automotive sector.
Auto Claims Assist will continue to track these dynamics and share data‑driven insights that help drivers and industry stakeholders navigate a rapidly changing sector.
About Our Analysis
This report is a synthesis of Auto Claims Assist's proprietary claims data from over 31,299 non-fault cases (2019-2025) and the latest available public data from leading UK industry and government bodies, including the Association of British Insurers (ABI), the Driver and Vehicle Licensing Agency (DVLA), the Office for National Statistics (ONS), the Institute of the Motor Industry (IMI), and specialist data provider Epyx. All figures are based on the most current information at the time of publication.